There are several probability density functions (PDFs) defined in R. You can find defined PDFs with "library(help='stats')" in R-console. Now, let's plot Gaussian distribution N(0,1) with *norm function.
# Probability density function
> curve(dnorm(x, mean=0, sd=1, log=FALSE), -3, 3, n=1001, col = "blue")
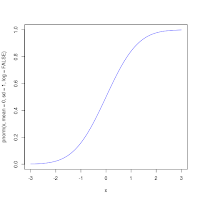
# Cumulative probability density function
> curve(pnorm(x, mean=0, sd=1, log=FALSE), -3, 3, n=1001, col = "blue")
# Probabilistic generative model
> rnorm(n=100, mean=0, sd=1)
  [1]  0.76291389  0.32249468  1.43329768  0.39455640 -0.96082434 -0.03498441
  [7] -0.98776053 -0.69866914  1.31514002 -1.42647303 -0.46658770 -1.32506735
 [13] -1.52074716  0.45169290 -1.11993007 -0.27547321  0.86232800 -2.36687435
 [19] -1.34228574 -0.72800613 -0.41979553 -2.24104445  1.86935264 -0.88038071
 [25] -0.71816560 -0.53788946  0.50974550 -1.23530999  0.77035374  0.06483997
 [31] -0.62251296  1.60636131  0.36695288  0.76654543  0.86672801 -0.75831284
 [37] -1.48413034 -0.37661399  1.34613939 -1.20912506 -0.22231654  2.66835415
 [43]  0.49528498  0.26435606 -0.74862141 -0.41349885 -0.94850251  0.83038086
 [49]  0.29994578 -0.15778865 -1.16049616  2.24109521  0.86357121  1.28825845
 [55]  0.50549591  0.08668917 -0.34392882  2.08620620 -0.02514741 -0.38974372
 [61] -0.07943300  1.01109304  1.26749487  1.65848787  1.40626520  0.13476383
 [67] -0.81541581 -0.23397894 -1.54089193  2.69271063  1.02584790  0.34583390
 [73]  0.35808556 -2.23486925 -0.97331144 -0.75742258 -1.49065873 -0.24702416
 [79]  1.46008300  0.26804260  1.25457656  0.55169794 -0.34509144 -1.24602872
 [85]  0.65070530 -0.69068100  0.98802706 -1.76179226 -0.30577751  0.30197949
 [91] -0.18236187 -0.86313716  1.36986087 -1.23400546 -0.78780711 -2.14942716
 [97]  1.17743473 -0.95787888 -0.27079632  1.79351280


No comments:
Post a Comment